In Afton Oaks, the Median Price Depends on Which Five Houses Closed This Month
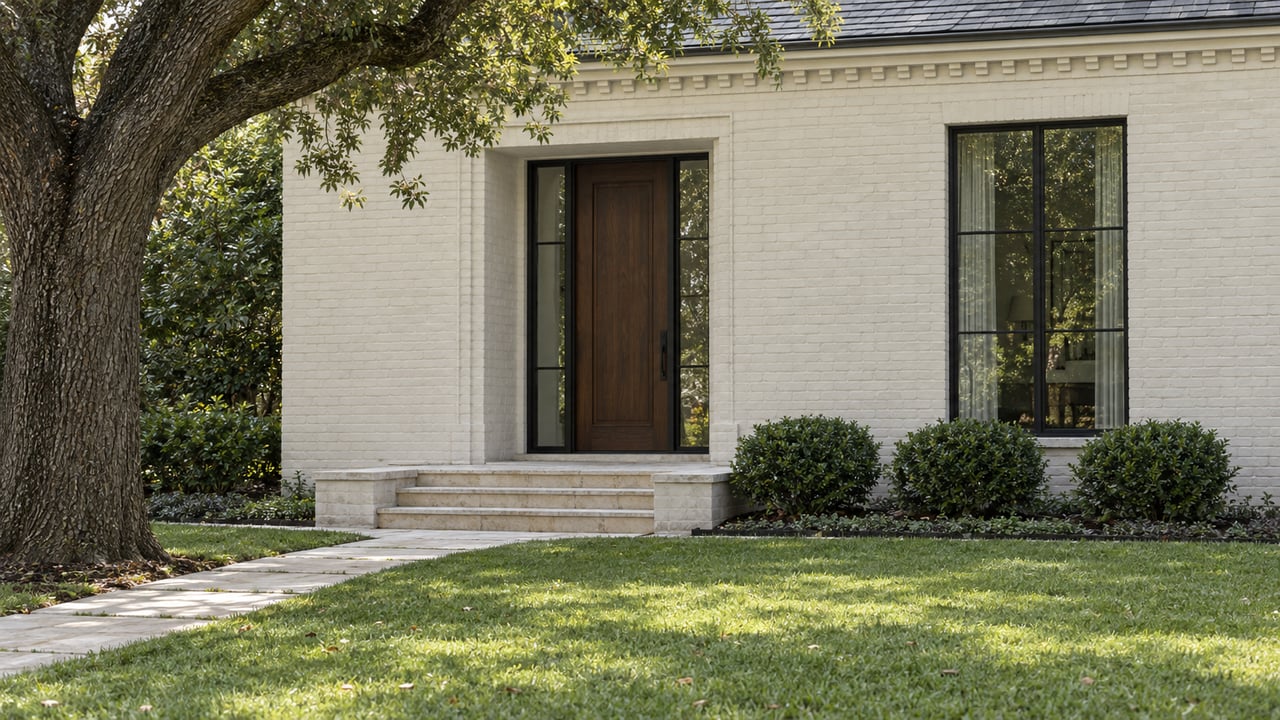
Pull up the pricing data for Afton Oaks on any given afternoon and you can build two entirely different arguments from the same neighborhood. Redfin's own market page recorded a 49.8 percent price drop over the three months ending April 2026. Scroll to a different page on the same site and the headline for March 2026 reads a 43.7 percent increase year over year. Zillow's home value index for the area shows two figures nearly $270,000 apart depending on which version of the tool you land on. Homes.com pegs the trailing twelve-month median at $996,250, down 11 percent. Orchard's last-30-day read puts it at $715,000, down 20.7 percent.
None of these sites made an error. They are all measuring the same small, deed-restricted subdivision and getting different answers because the underlying math cannot support the kind of confident single number a portal wants to display.
Afton Oaks is a deed-restricted Inner Loop community of roughly 525 homes, a scale documented on the neighborhood's own Wikipedia entry. That is not a large enough pool to smooth out the natural lumpiness of a housing market. In a given month, one tracking page recorded just five closings across the entire neighborhood. When your sample size for "this month's median" is five houses, the number stops describing the market and starts describing whichever five houses happened to close.
Swap a $699,000 1950s ranch for a $3.15 million new build in that group of five and the median moves by a margin that would make headlines in a larger submarket. Swap it back the following month and the trend reverses. Every portal is reporting real transaction data. What differs is which handful of transactions each snapshot happened to catch, and how each site weights list price against closed price against a rolling average.
The active listings in Afton Oaks as of early September 2026 show exactly the kind of spread that produces this noise. On Waring Street, a 5,661-square-foot home built in 2026 is listed at $3,150,000, while a few doors down a 4,814-square-foot home from 2018 is listed at $2,598,000. On Newcastle Drive, a 4,746-square-foot contemporary build finished in 2026 carries a $2,199,950 asking price. Meanwhile on Ingersoll Street, a 1956 traditional at 2,238 square feet is listed at $699,000 after a price reduction, and a 1956-built home on West Alabama Street at 2,535 square feet is asking $1,050,000.
That is a roughly $2.45 million spread among homes inside the same zip code, several within walking distance of each other. A market data feed pulled from Multiple Listing Service activity in this window put the median list price across six active Afton Oaks listings at $2,398,975, with an average of $512.99 per square foot. Compare that to the 1956 ranch on Ingersoll, priced at roughly $312 per square foot, and the gap is not a pricing mistake. It is two different products sharing one zip code: a mid-century remodel candidate and a finished, permit-complete new build on a similar lot.
If the median price were the only unstable figure, you could argue it was a fluke of one metric. It isn't. Days on market shows the same scatter. Redfin's neighborhood page listed an average of 65.5 days. Homes.com listed 47 days, faster than its cited national average of 58. Redfin's own luxury-homes tracking page for the same neighborhood put it at 52 days with an average of one offer received. The live MLS snapshot from early September 2026 showed an average of 38 days across the six homes then active.
Four readings, four numbers, one small neighborhood. The pattern matches the price data because the cause is the same: too few transactions in any single window to produce a stable average, whether the metric is dollars or days.
The practical takeaway for anyone comparing Afton Oaks to other close-in Houston neighborhoods is to stop treating the published median as a benchmark and start treating it as a rough sketch that needs correction. The correction is straightforward: match product to product.
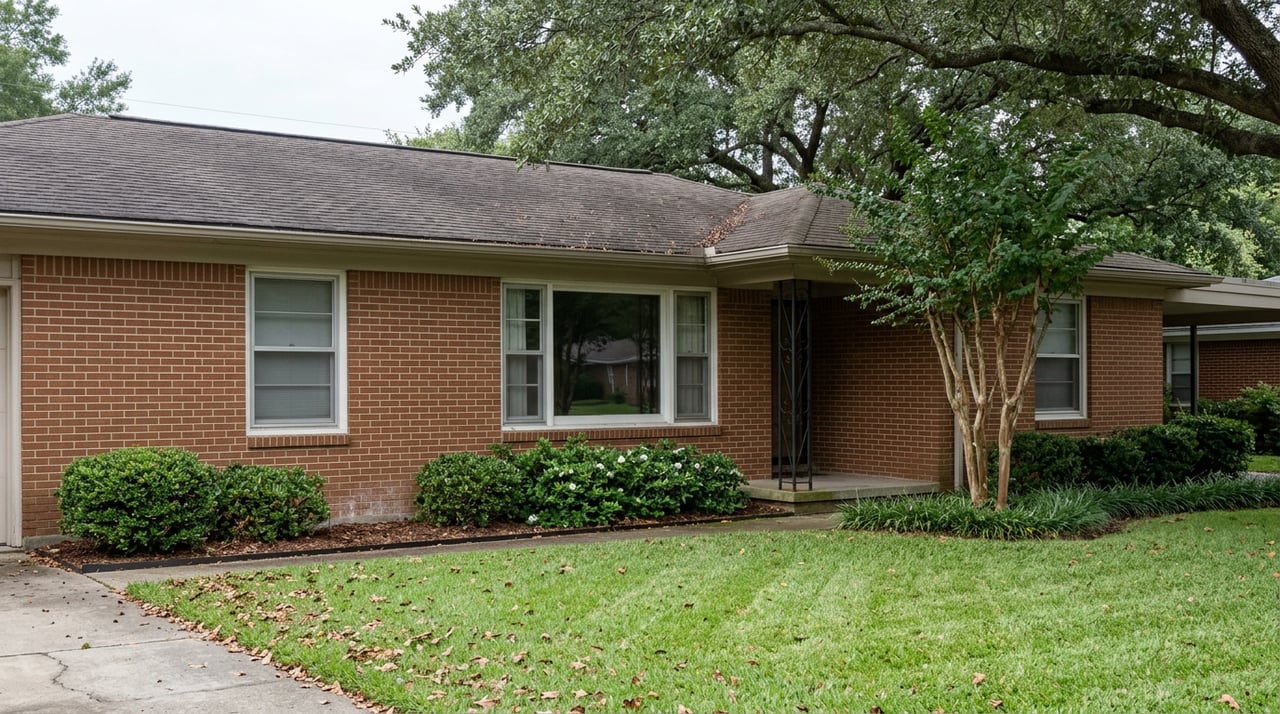
A buyer weighing a 1950s ranch against a new build in Afton Oaks is not comparing two prices for the same thing. They are comparing a renovation project with known bones and an established lot against a finished home with current systems, current code compliance, and no deferred maintenance. The per-square-foot gap between the Ingersoll Street ranch and the Waring Street new build reflects that difference in what you are actually buying, not a disagreement about whether the neighborhood is appreciating.
A seller pricing a home for this market benefits from the same discipline. Rather than anchoring to whichever median a search turned up, the more useful comparison is recent closed sales of homes matching the same era, size, and finish level, layered with what the early-September listings on the same block were asking per square foot. The Afton Oaks Civic Club, chartered in 1955, still enforces the deed restrictions that keep lot sizes and setbacks consistent across the neighborhood's nine subdivisions, which means the housing stock itself is more uniform than the price data suggests. The comparison that actually holds up is finished square footage and build year, not a blended average pulled from five unrelated closings.
Does a reported price drop mean Afton Oaks homes are losing value?
Not necessarily. A trailing-window drop in a market this size can reflect a shift in which type of home happened to sell, not a shift in what any individual home is worth. Two neighboring homes of comparable size and finish can move in opposite directions on paper without either one actually losing ground.
How should I compare Afton Oaks pricing to a nearby neighborhood?
Match the product first. Compare a 1950s ranch in Afton Oaks to a similarly aged ranch nearby, and a new construction home to another new construction home, rather than letting a blended median stand in for either comparison.
Is this kind of data noise common in other small Houston enclaves?
It shows up wherever a subdivision is small, deed-restricted, and bounded, since a limited total home count means every reporting window is working with a small sample. Larger, less bounded submarkets with hundreds of monthly closings do not show the same swings, because more transactions average out the mix.
If you are trying to make sense of what a specific Afton Oaks listing is actually worth, or how it stacks up against a comparable home a few blocks away, that is a conversation best had over the real comps rather than a portal's headline number. Caroline Bean works this exact stretch of the Inner Loop and can walk through what the early-September listings on Waring, Newcastle, and Ingersoll actually tell you about your specific situation.
This article is general information, not legal, tax or financial advice. Consult a qualified professional about your situation.
Stay up to date on the latest real estate trends.

A consistent top producer, clients appreciate Caroline's hard work, responsiveness, and total dedication to their needs. She's known for her elite sales skills, impeccable client service and an ability to expertly drive any type of deal, including first-time buyers, new construction sales, resales, or relocations.